
Much of what matters to us happens before we click.
We recognize a familiar face, notice the detail we were searching for, or find ourselves drawn back to an image. These moments shape what we do next. Software usually encounters them through an action: a selection, a search, a rating.
As AI systems generate and adapt more of what we see, the quality of that feedback matters more. A system can now produce a hundred alternatives in seconds. Knowing how a particular person responds to each of them is the harder problem.
At Kyma, we believe visual attention can offer another source of information: a response tied to what a person is seeing, including items they never explicitly select. We’re exploring how to make that signal measurable and usable in software. In one of our first experiments, it identified a card the wearer had chosen privately in 15 of 17 attempts.
An established signal, a different setting
In 1965, Sutton and colleagues reported a brain response that grew larger when a stimulus was harder to predict [1]. It became known as the P300: a positive deflection in the EEG that typically appears about 300 milliseconds after an event, and one of the most studied responses in cognitive neuroscience [2]. The P300 is not the only response attention changes. Even earlier, within the first 200 milliseconds of visual processing, attended objects evoke larger responses than ignored ones [3].
Over the following decades, researchers turned these responses into interfaces: spelling by attending to flashing letters [4] and finding targets in rapid streams of images [5]. That work established a simple principle: when a brain response is aligned with what someone is seeing, software can tell what they are attending to. Most of it took place in laboratories. We’re building on that foundation with a wearable and personal models that bring the signal to the software people use every day.
Bringing that signal out of the laboratory starts with the hardware. The responses in this article are a few microvolts in size, recorded in an ordinary room rather than a shielded laboratory. We engineered the Kyma band’s electronics and design for low noise and steady electrode contact, so that responses long measured with laboratory systems can be resolved in a headband worn in everyday settings. The electrodes are swappable, so the band can be fitted with the type that suits where it is worn and the wearer’s hair: for these experiments, soft brush comb electrodes that reach through hair at the back of the head. Recovering a classic attention response well enough to identify a privately chosen card is a demanding test of that signal quality.
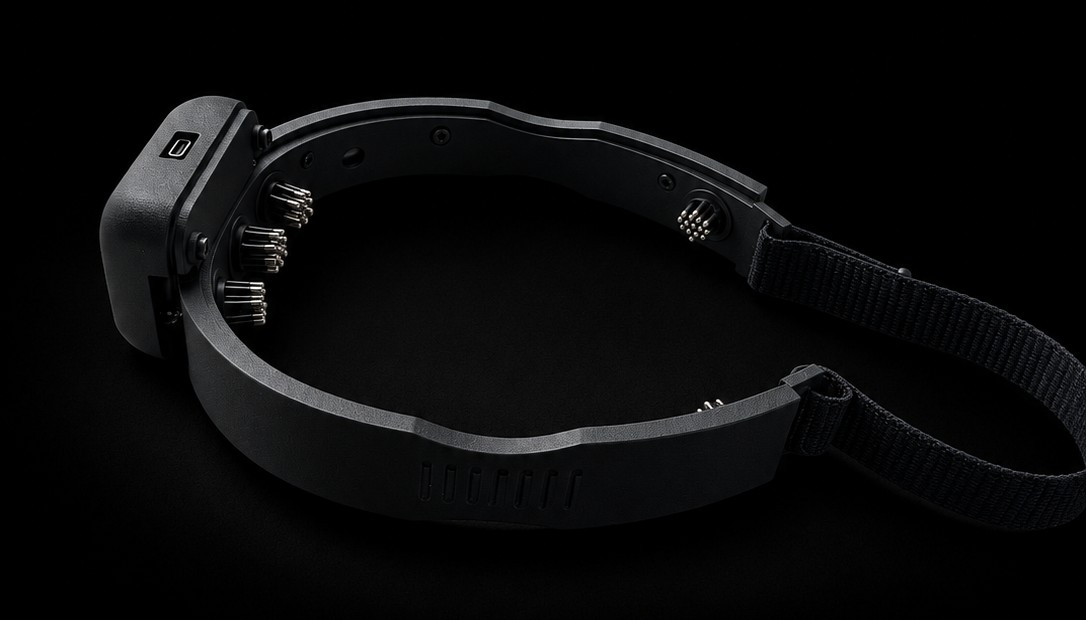
We ran these experiments with the modular Kyma band, positioned over the occipital lobe at the back of the head. As the cards appear one at a time, the wearer’s chosen card draws a different response from the other seven. The difference shows up in calibration, when the wearer is told which card to watch, and again when the choice is private.
Watching a choice emerge
Eight cards appear in turn. The wearer attends to one they have privately chosen. The experiment knows which image appeared and when; the task is to recover the choice from the recorded responses. Each card appears alone in the centre of the screen, in the same spot, so the eyes do not need to move to find the chosen one. Every calibration run in a session uses a different target card, and every result is scored on data the model did not train on, so the model cannot simply learn what one card looks like.
Because each card appears many times, the evidence can be watched as it builds. A single response may be ambiguous; repeated appearances make the pattern clearer. In the filmed example, the ten of hearts separates from the other seven cards within about 14 seconds.
Across 17 private-choice attempts from three sessions, the chosen card ranked first 15 times. Thirteen of those attempts were also scored live, as they happened, and eleven of the thirteen were correct. Each attempt offered eight cards, so a random selection would succeed 12.5% of the time.
The curves show how each choice takes shape. In some attempts, the chosen card pulls away from the alternatives early; in others, the scores stay close for longer. That changing separation gives an interface more to work with than a final answer: it can track whether one option has a sustained lead or whether the result is still unsettled. This could help it decide when to offer a selection, collect more responses, or ask the wearer to confirm.
Across a broader set of 41 evaluated selections, the right card ranked first 39% of the time after about 3.6 seconds and 88% after 36 seconds. Speed and certainty trade off, and an application can choose where on that curve to sit.
What the model learns is not the card itself. Every card evokes a visual response; the chosen card evokes a different one, because attention changes how the brain processes it. Decades of research describe two parts to that change. Within the first 200 milliseconds, visual cortex amplifies its response to an attended item [3]. A few hundred milliseconds later, a larger response reflects the brain registering that the item it was waiting for has appeared [2]. In our recordings, the clearest difference came 300 to 600 milliseconds after each appearance (Figure 1). The wearer never acts on the card, yet its significance is carried in the timing and shape of the response.
The practical opportunity is to design around that relationship. A response unfolds within hundreds of milliseconds, while a confident interaction may need several measurements. A search interface, a selection tool, and a feedback system for AI can each make a different use of the same accumulating evidence.
From a chosen card to something familiar
The card experience gives attention a clear target. Photographs introduce a richer question. An image can stand out because of how it looks, because it is familiar, or because it relates to something we are trying to find.
We explored this with three photos of the wearer’s dog among 30 other dog photos, including similar breeds. On the first pass, the familiar photos ranked eighth, eighteenth, and twenty-first.
We then presented the top 11 again. The familiar photo that remained rose from eighth to first.
The other ten photos returned in a broadly similar order, with a rank correlation of 0.81. That repeatability matters. Each photo drew a consistent response of its own, and against that background the familiar photo moved to the top.
We repeated the search in a later session with the same 33 photos in a new order. This time, on the first pass, one of the wearer’s dog photos ranked first; the other two ranked 11th and 13th. That is encouraging rather than conclusive. By chance, at least one of three photos ranks first 9% of the time, and the three ranks together give p ≈ 0.06.
The two passes pull apart two influences that are usually tangled together. Part of the brain’s response is driven by the image itself: its contrast, its composition, how much it stands out from the images around it. Visual cortex responds to these properties whether or not the person cares about the picture, and they help explain why the other ten photos kept their order. Another part depends on what the person brings to it. Personally significant images, such as one’s own face, draw larger responses than unfamiliar ones [6], and a search goal raises the response to whatever matches it. The consistency across passes reflects the first influence. The familiar photos’ rise, on the second pass in one session and on the first pass in the next, is an early sign of the second.
Separating the two is the next step. Showing the same images during passive viewing and during explicit search lets us measure each image’s own pull and account for it. This is where visual attention starts to become interesting as a software capability: the measurement has to connect what is presented with what matters to the person seeing it.
What attention could add to feedback
The value of neural feedback depends on what it adds to what software already observes. A click tells software what a person selected. It says little about the alternatives: which were recognized, which held attention, and which were passed over despite being relevant. A response measured during presentation can help fill that gap, including for options that never receive an explicit action. Research on information retrieval has already combined brain signals with other feedback, reporting better document ranking, especially where behavioral feedback is missing or noisy [7][8].
For AI, that suggests a richer loop than asking for a rating after every output. We built an experience that cycles through unseen AI-generated images and ranks them by the recorded response. This single passive set did not establish preference decoding, but it makes the loop tangible: generated options are presented, responses are aligned with each one, and the resulting evidence becomes something a learning system could use.
The meaning of the signal matters. A strong response may reflect recognition, surprise, difficulty, or dislike, and training a system to produce stronger responses would be a different objective from helping it understand a person’s goals. The test is whether the measurement helps a system serve the person better: finding relevant material, reducing the effort of giving feedback, or resolving what clicks and viewing time leave open, with the wearer controlling when it is collected and how it is used.
Learning across sessions
A useful personal model has to carry information from one experience to the next. The same person’s recording changes each time they wear the band, yet the response itself held steady. Recorded a day apart, the calibration response showed the same dip from 300 to 600 milliseconds, at nearly the same size, while its earlier and later parts varied.
We explored whether combining recordings could help establish a useful signal with less new calibration. In an offline comparison, adding other sessions from the same wearer to two calibration runs improved held-out performance in three of four sessions; in the fourth, which already had the strongest calibration, it was slightly lower. A model built only from earlier sessions, with no calibration that day, identified the target card in all six of the latest session’s calibration runs.
These results come from one team member. Repeated recordings let us ask whether useful information carries across experiences for that person. Testing additional wearers will establish how consistently we can make the same capability available to each of them. Personal models are part of that work: a way to account for individual responses and changing recordings as we make the signal usable.
Our strongest session used two recording channels and reached a single-presentation AUC of 0.83, where 0.5 is chance. A few channels can capture useful patterns in the broad neural activity that reaches the scalp. EEG also mixes activity from multiple sources, and movement, eye activity, and electrical interference can affect the recording [9]. Stable electrode contact and low electrode–skin impedance help limit noise [10].
Making the signal available
Visual attention is one of many signals we are working with at Kyma. Starting with established responses lets us build the recording, interpretation, and software interfaces around something we can test directly. Modern AI gives us new ways to use that foundation: systems that generate alternatives, adapt over repeated interactions, and learn from feedback that was previously difficult to collect.
In Kyma Studio, My Brain is where a person sees the states Kyma has learned from them: a blink, a jaw clench, how relaxed or focused they are. Each one shows how well it has been verified on that person and lights up live. Visual attention fits the same pattern. It starts with a short calibration, carries forward from one wear to the next (Figure 8), and keeps its own record: how well the band read you in each session, and how good the contact was. That makes it a state you can track over time and use as an input.
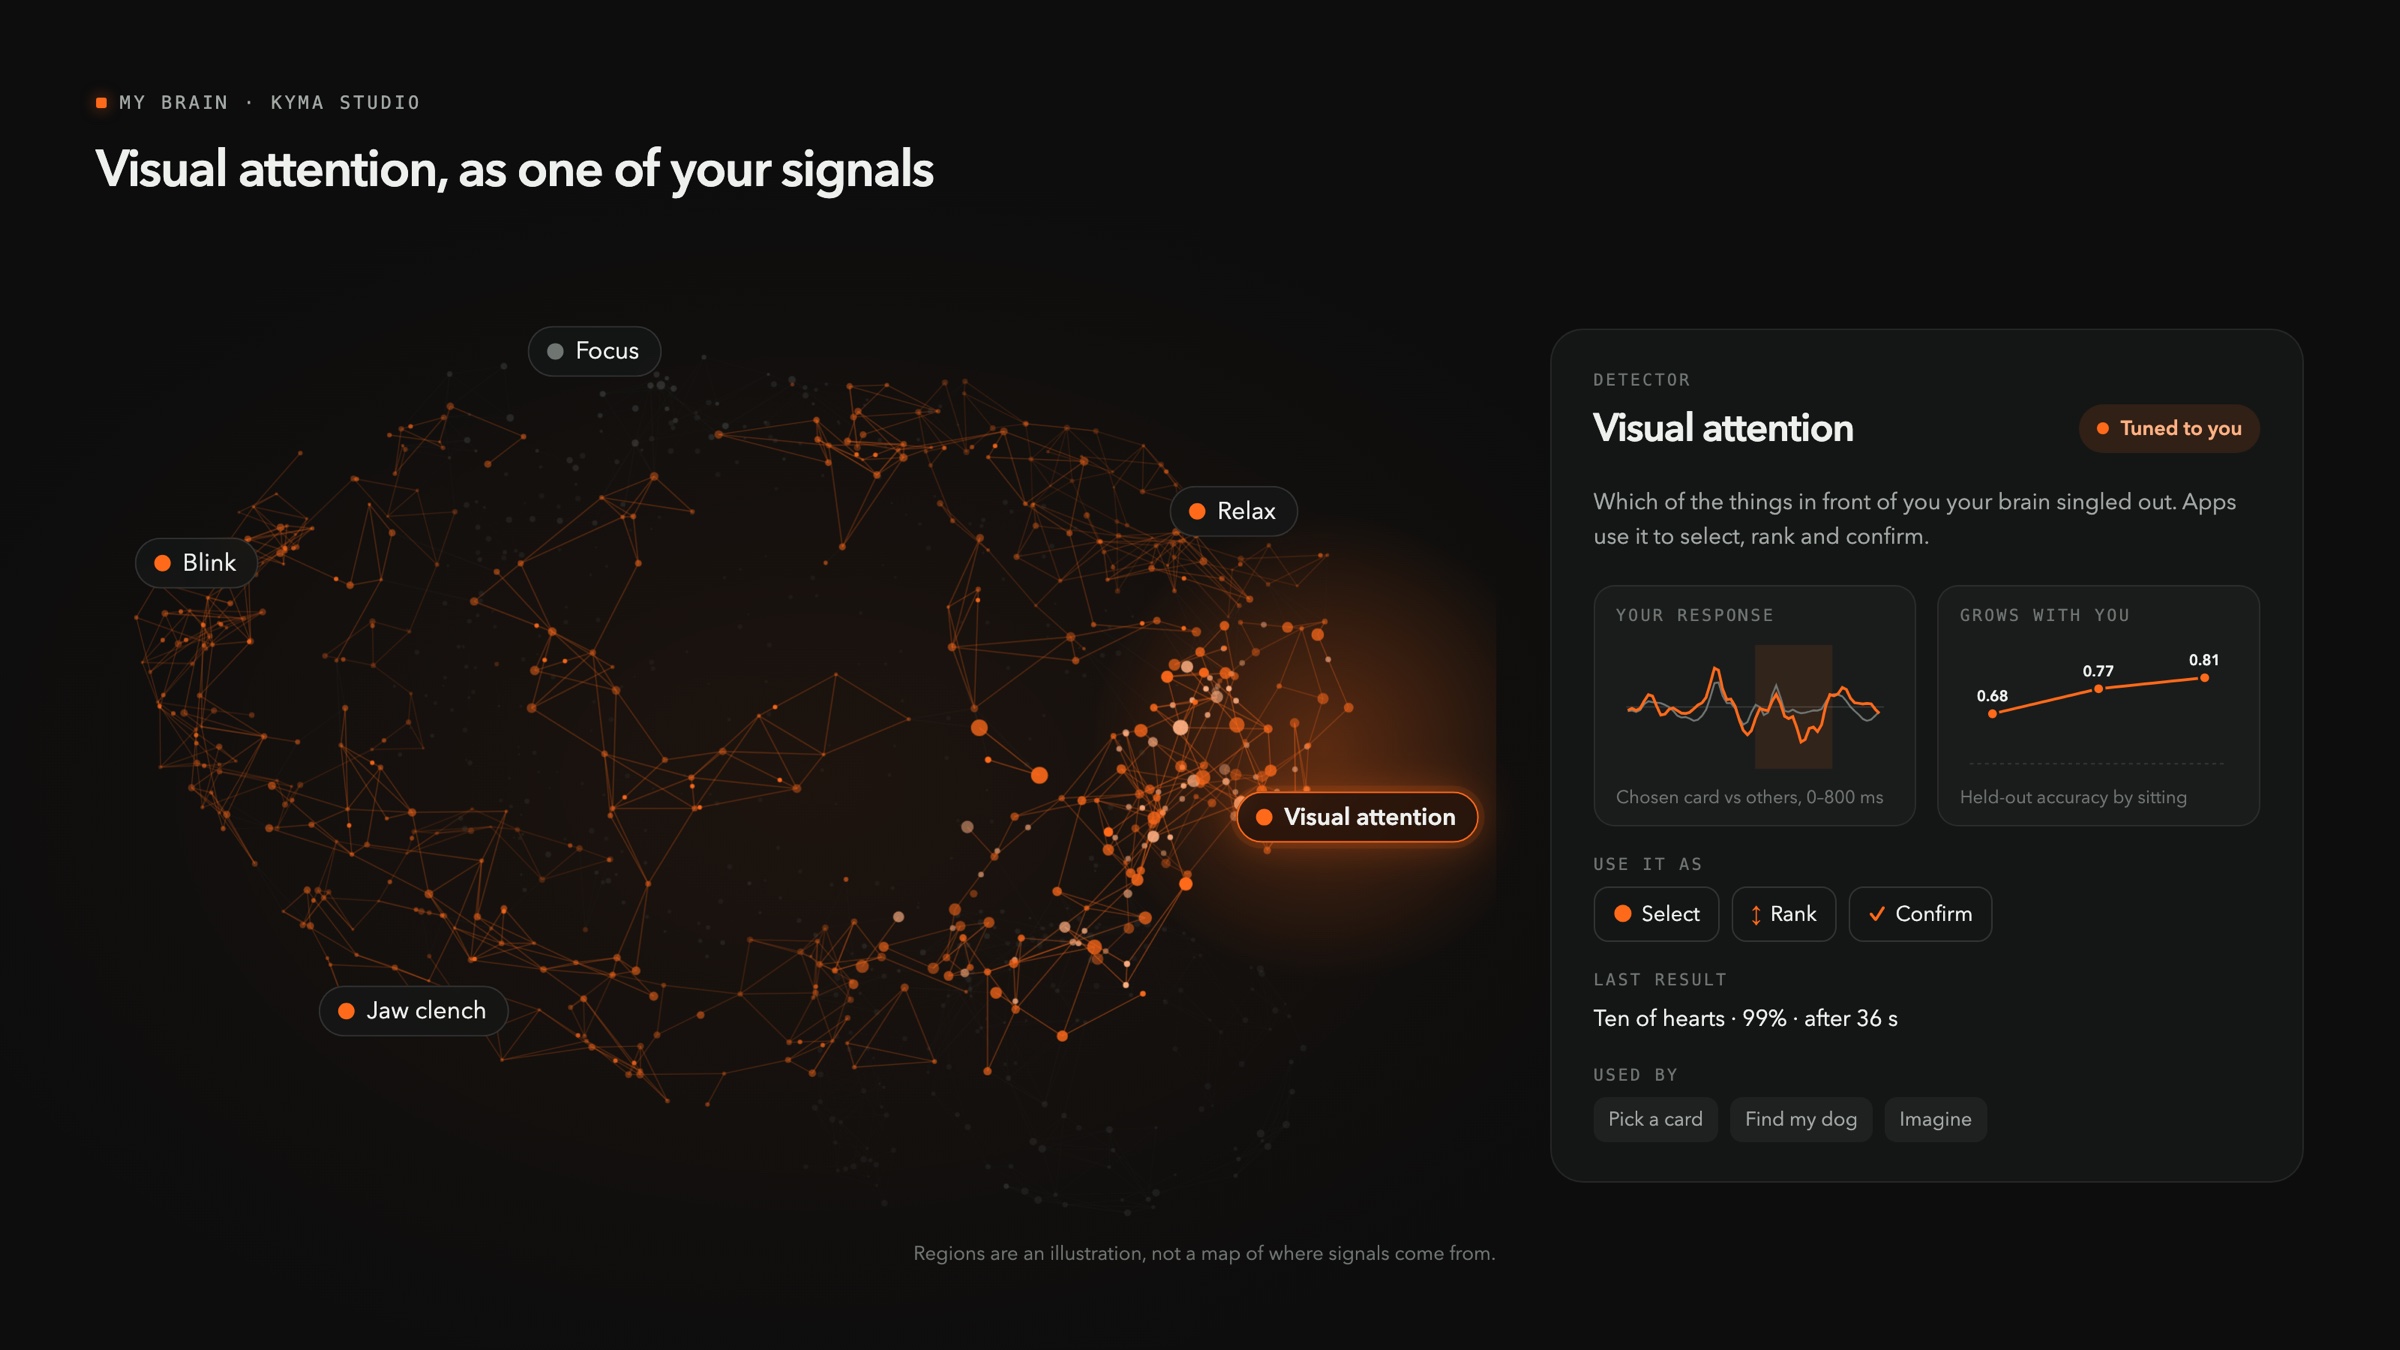
Which states are within reach depends on where the band sits. The modular band can be oriented across the forehead or around to the back of the head, and each orientation reaches different activity: blinks and frontal rhythms at the front; at the back, the visual cortex’s alpha rhythm and visual responses like the one in this article. Every new orientation opens new states to validate on a person, and every validated state becomes something new to track and build on.
That is what we plan to bring to developers: personal model APIs that let anyone build on states validated for each wearer, starting with visual attention, rather than on raw EEG. An application would receive results such as ranked options, evidence strength, and recording quality, with access controlled by the wearer. Those results could support an immediate interaction or contribute to a longer learning process.
Founding Batch members will be the first to test these developer tools. Learn about early access.
These examples show what becomes possible when a wearable connects a brain response to an experience. We can measure that response, relate it to what someone is seeing, and use it to recover a choice. The next challenge is to make that information dependable and useful across more people and more contexts.
The signal has been studied for decades. We’re rethinking what it can do in an era when software can learn from it.
About the recordings and analysis
Every result is scored on data the model did not train on. Each session begins with a short calibration, which trains a simple model on the brain’s response in the first 800 milliseconds after each image. Private choices are then scored with that session’s model.
The card scores in the figures are relative model scores, not validated probabilities. The session-pooling comparison is retrospective. The dog-photo retest used only the top 11 photos from the first pass. The AI-image experience does not yet show preference decoding or improved AI training.
References
- Sutton S, Braren M, Zubin J, John ER (1965). Evoked-potential correlates of stimulus uncertainty. Science 150:1187–1188. pubmed.ncbi.nlm.nih.gov
- Polich J (2007). Updating P300: an integrative theory of P3a and P3b. Clinical Neurophysiology 118:2128–2148. pmc.ncbi.nlm.nih.gov
- Hillyard SA, Anllo-Vento L (1998). Event-related brain potentials in the study of visual selective attention. PNAS 95:781–787. pmc.ncbi.nlm.nih.gov
- Farwell LA, Donchin E (1988). Talking off the top of your head: toward a mental prosthesis utilizing event-related brain potentials. Electroencephalography and Clinical Neurophysiology 70:510–523. pubmed.ncbi.nlm.nih.gov
- Gerson AD, Parra LC, Sajda P (2006). Cortically coupled computer vision for rapid image search. IEEE Transactions on Neural Systems and Rehabilitation Engineering 14:174–179. pubmed.ncbi.nlm.nih.gov
- Tacikowski P, Nowicka A (2010). Allocation of attention to self-name and self-face: an ERP study. Biological Psychology 84:318–324. pubmed.ncbi.nlm.nih.gov
- Eugster MJA, Ruotsalo T, Spapé MM, et al. (2016). Natural brain-information interfaces: recommending information by relevance inferred from human brain signals. Scientific Reports 6:38580. arxiv.org
- Ye Z, Xie X, Ai Q, et al. (2023). Relevance Feedback with Brain Signals. arxiv.org/abs/2312.05669
- Jung TP, Makeig S, Westerfield M, et al. (2001). Analysis and visualization of single-trial event-related potentials. Human Brain Mapping 14:166–185. pmc.ncbi.nlm.nih.gov
- Kappenman ES, Luck SJ (2010). The effects of electrode impedance on data quality and statistical significance in ERP recordings. Psychophysiology 47:888–904. pmc.ncbi.nlm.nih.gov